IR Index
In recent years, FT-IR (Fourier Transform Infrared) spectroscopy has become established as one of the most important techniques for assessing used lubricants. Whether for oils or greases, OELCHECK produces an infrared diagram during every analysis. This examines possible ageing of the lubricant, detects contaminants and identifies mixture with other types of oil. The analysis of the IR spectrum informs the diagnosis of the OELCHECK engineers. Every OELCHECK laboratory report includes a diagram of the infrared spectra of the used lubricant and its fresh counterpart, provided the oil designation has been given. However, extensive knowledge is required to be able to interpret an infrared spectrum. This is provided in specific OilDoc seminars or as online training. For those who do not wish to study the subject in quite as much depth, the new IR index from OELCHECK now offers a reference value to enable a faster understanding when comparing two IR spectra. OELCHECK is currently the only laboratory that reliably calculates and communicates this value!

The principle of FT-IR spectroscopy is based on there being different molecules present in the lubricant which, because of their typical chemical structures, absorb infrared light to different degrees with certain wavelengths. Changes in the used oil can be compared to the fresh oil reference spectrum and depicted, calculated and interpreted as a deviation from typical „peaks“ or changes in areas for certain „wave numbers“. The infrared spectrum of a sample provides information on ageing-related changes in the oil and contaminants from water, soot, other oil or fuel compared to the spectrum of a corresponding fresh oil or reference oil. Every spectrum is as unique as an individual human fingerprint.
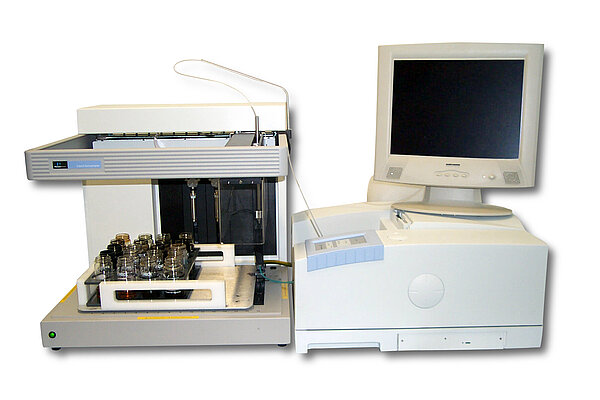
The diagram of the IR spectra of the used and corresponding fresh oil have been provided on the OELCHECK laboratory reports as standard for years. However, this service is now being enhanced with an essential component. OELCHECK has installed two new additional „PerkinElmer Spectrum Two“ testing devices in the laboratory. As state-of-the-art devices, they are not only considerably more compact than their predecessor models, but with an integrated autosampler they also work faster and calculate an IR index using OELCHECK-enhanced software which is now given in all laboratory reports.
This means that OELCHECK is currently the only laboratory that reliably calculates and communicates this value! The IR index allows a faster understanding of the findings of the respective IR spectrum. The higher this is, the smaller the changes in the used oil sample are in relation to the fresh oil or reference sample. When considering the IR index in question, it is essential that the oil type is known. While a value below 99 could be cause for concern in a turbine oil, for example, the limit for an engine oil is around 85.
The IR index is calculated using linear regression. This can be represented visually in a diagram. For each wave number, the absorption in the fresh oil is plotted against the x-axis and in the used oil against the y-axis. When there is absolute correlation, this produces a straight line. (However, particular regions, such as those with extremely high absorption resulting from hydrocarbon bases, are not relevant and are excluded.) The closer the points being compared are to the straight lines, the lower the deviations.
Given that a graph is difficult to read, we do not include one in the laboratory reports, but instead show the two spectra in a diagram (which can also be downloaded and enlarged at www.lab.report). We also give the practical numerical value of the IR index in the laboratory report as a correlation coefficient.
Examples
Example 1
The IR index of a used engine oil is only 70.38! The two spectra deviate significantly from each other in some regions as a result of high oxidation, nitration and sulfation of the used oil. The regression line illustrates this accordingly. The lubricant has aged considerably and must be changed as a matter of urgency. The cause of the extreme ageing must also be identified and remedied.
Example 2
Here everything is as it should be. The IR index is 99.90. The spectra virtually coincide. Correspondingly, there is virtually no change in the used oil compared to the fresh oil. Further use may still be considered even if the values for the additives and wear elements and the viscosity values fall within the permitted limits.
Conclusion
OELCHECK customers benefit from our experience, unique service and pioneering innovations. For example, as the first laboratory for lubricant analysis, we introduced the PQ index back in 1994. Unlike with elemental analysis using ICP or RDE, with the PQ index magnetisable iron particles are also recorded, regardless of their size. As a key element in the early detection of wear, today the PQ index is a universal standard. OELCHECK has been performing IR spectroscopy for all samples for 25 years and now has approximately 2.5 million spectra in its database. For 15 years the spectra have been printed in the laboratory report and can be downloaded from the customer portal. With the new IR index, OELCHECK is once again setting standards, providing an important value with a practical application for faster assessment of the two IR spectra being compared. The new IR index is not a substitute for the assessment of the spectra by OELCHECK diagnostic engineers. Rather, users of our laboratory reports can now use the given values of the IR index to gain a clearer understanding, as opposed to making a time-consuming visual comparison of the spectra. This will allow you to see at a glance whether the values of the used oil and fresh oil still correspond to one another to such an extent that no oil change is required.
OELCHECKER Winter 2015, page 3


