Infrared spectroscopy - key element of modern oil analysis
Year of publication: 2008
Whether it is a question of identity testing or assessing the continued serviceability of lubricants, infrared spectroscopy is one of the most important elements of modern oil analysis. It is contained in every OELCHECK analysis kit.
The measuring principle, some of the characteristic values determined with it and their role in the used oil evaluation were already explained in the ÖlChecker Frühjahr 2000 (only available in German). Because of the great importance of this FT-IR method, which has now been expanded to include about 70 parameters, sample and reference spectra are printed on each laboratory report whenever possible. In order to deepen the basic understanding, the most important fundamentals of the evaluation of infrared spectra are presented here.
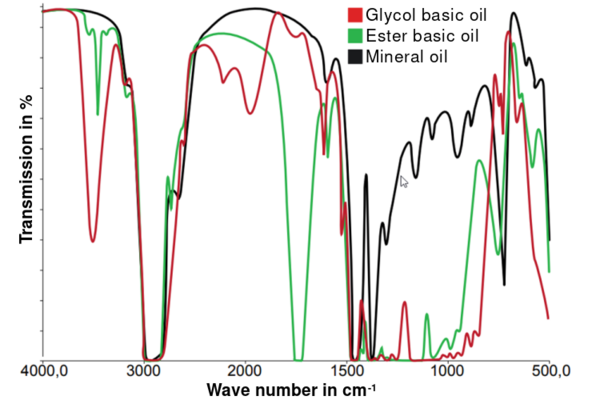
We speak of an "FT" IR diagram because the diagram is transformed into a more readable form by means of the Fourier transform. In the diagram, the transmission of the light is shown on the vertical Y-axis, and the wavelength of the infrared light, given in wavenumbers, is shown on the horizontal X-axis. This shows how much of the light introduced into the measuring cell is still detected after leaving this cell. The IR diagram is often referred to as the "fingerprint" of the oil type in question.

An FT-IR diagram can be divided into two different sections:
- The range of wave numbers above 1,500 cm-1 identifies functional groups of chemical compounds such as esters, glycols or mineral oils.
The range of wave numbers below 1,500 cm-1 provides information about the "skeletal vibrations", i.e. the structure of the molecules as a whole. This area is also called the "fingerprint area".
The observer can already tell with a little practice whether the oil is a mineral oil, ester oil or glycol-based synthetic oil, all based on the IR diagram printed on the OELCHECK laboratory report. In addition, significant additive compounds are detectable in the IR spectrum, with changes indicating additive degradation, blending, or a different oil.
As a general rule, compounds attributed to the "natural" constituents of oil are visible in the diagram as rather wide cuts, often reaching the "bottom". This applies, for example, to the "C-C" or "C-H" bonds contained in any hydrocarbon, or to the "C=O" bonds contained in an ester-based oil. The additives, on the other hand, which are often present only in small quantities, tend to show a "pinhole-like" appearance in the diagram. These "peaks" have only a relatively small extension. This applies, for example, to phenolic antioxidants, or to additives that change the viscosity-temperature behavior (VI improvers).
However, the diagram on the laboratory report, which can be enlarged at lab.report/app/, is not suited for precise evaluation. To provide accurate values, high-resolution graphics and special evaluation software are required to compare the spectrum of the fresh oil with that of the used oil. The evaluating tribologist must have a profound knowledge of the structure of different oil types, their additives and the influence of aging on the oil if he wants to comment on all parameters individually.
In practice, it is not uncommon for different types of oil to be mixed. Sometimes a different type of oil is used than the one specified by the customer in good faith, or residual amounts of the previous oil remain in the system when the oil is changed. The spectrum of each individual oil sample, including the reference spectrum, is immediately available to the experienced tribologist on the screen when calling up the sample data. He can thus see at first glance whether the IR used oil spectrum corresponds at all to the fresh oil spectrum of the oil class specified by the customer. For this purpose, the software superimposes the two spectra and shows whether they are congruent at the decisive points. If no oil designation is given on the Sample Information Form, the best matching reference spectrum must be selected from the extensive OELCHECK database according to the "best match principle".
For comparison, an extensive database with hundreds of fresh oil samples can be accessed immediately. Only when the oil type is identified does the tribologist begin evaluating the metrics determined at specific "band areas" of the IR. In the case of synthetic base oils or oils containing certain additives, however, a value determined by the IR method may not be relevant for this type of oil because, for example, ester-based components prevent the oxidation value valid only for pure mineral oils from being determined.


