Visual evaluation of oil samples
Year of publication: 2004, updated: 2024
Up to 2000 oil samples arrive at the OELCHECK laboratory for analysis every day. Before they undergo the individual tests, depending on the scope of the analysis, the question being asked and the type of oil, they are automatically evaluated visually. This is because the appearance of the oil often provides interesting information. The change in oil colour, particulate impurities and any turbidity caused by water play a very special role in the evaluation of the sample.
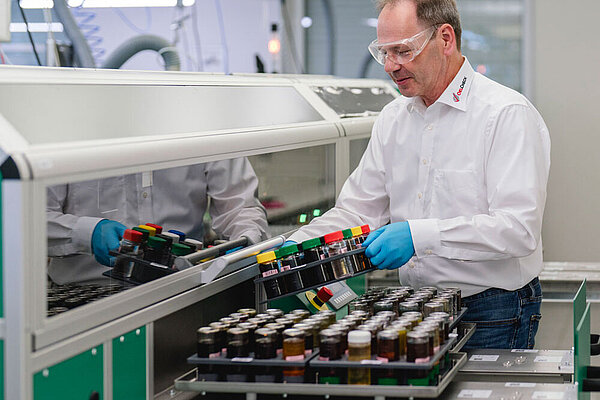
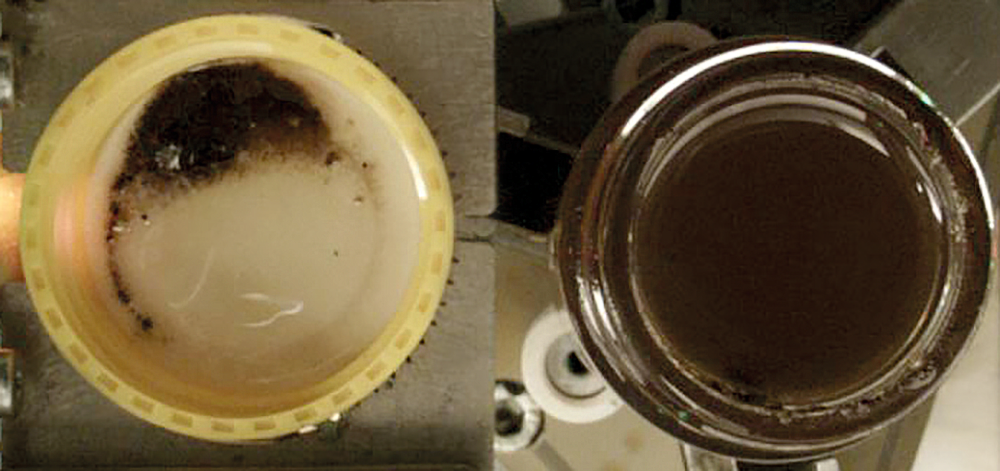
After unpacking, the sample containers are grouped into the 20 sample trays according to origin. Engine oils are placed next to engine oils and hydraulic oils next to hydraulic oils. The filled sample racks with their transparent OELCHECK bottles are stored upside down, i.e. standing on the lid, for at least 15 minutes; any foreign matter in the oil will then sink to the white inner surface of the lid and will be easier to see when the lid is turned upside down and opened.
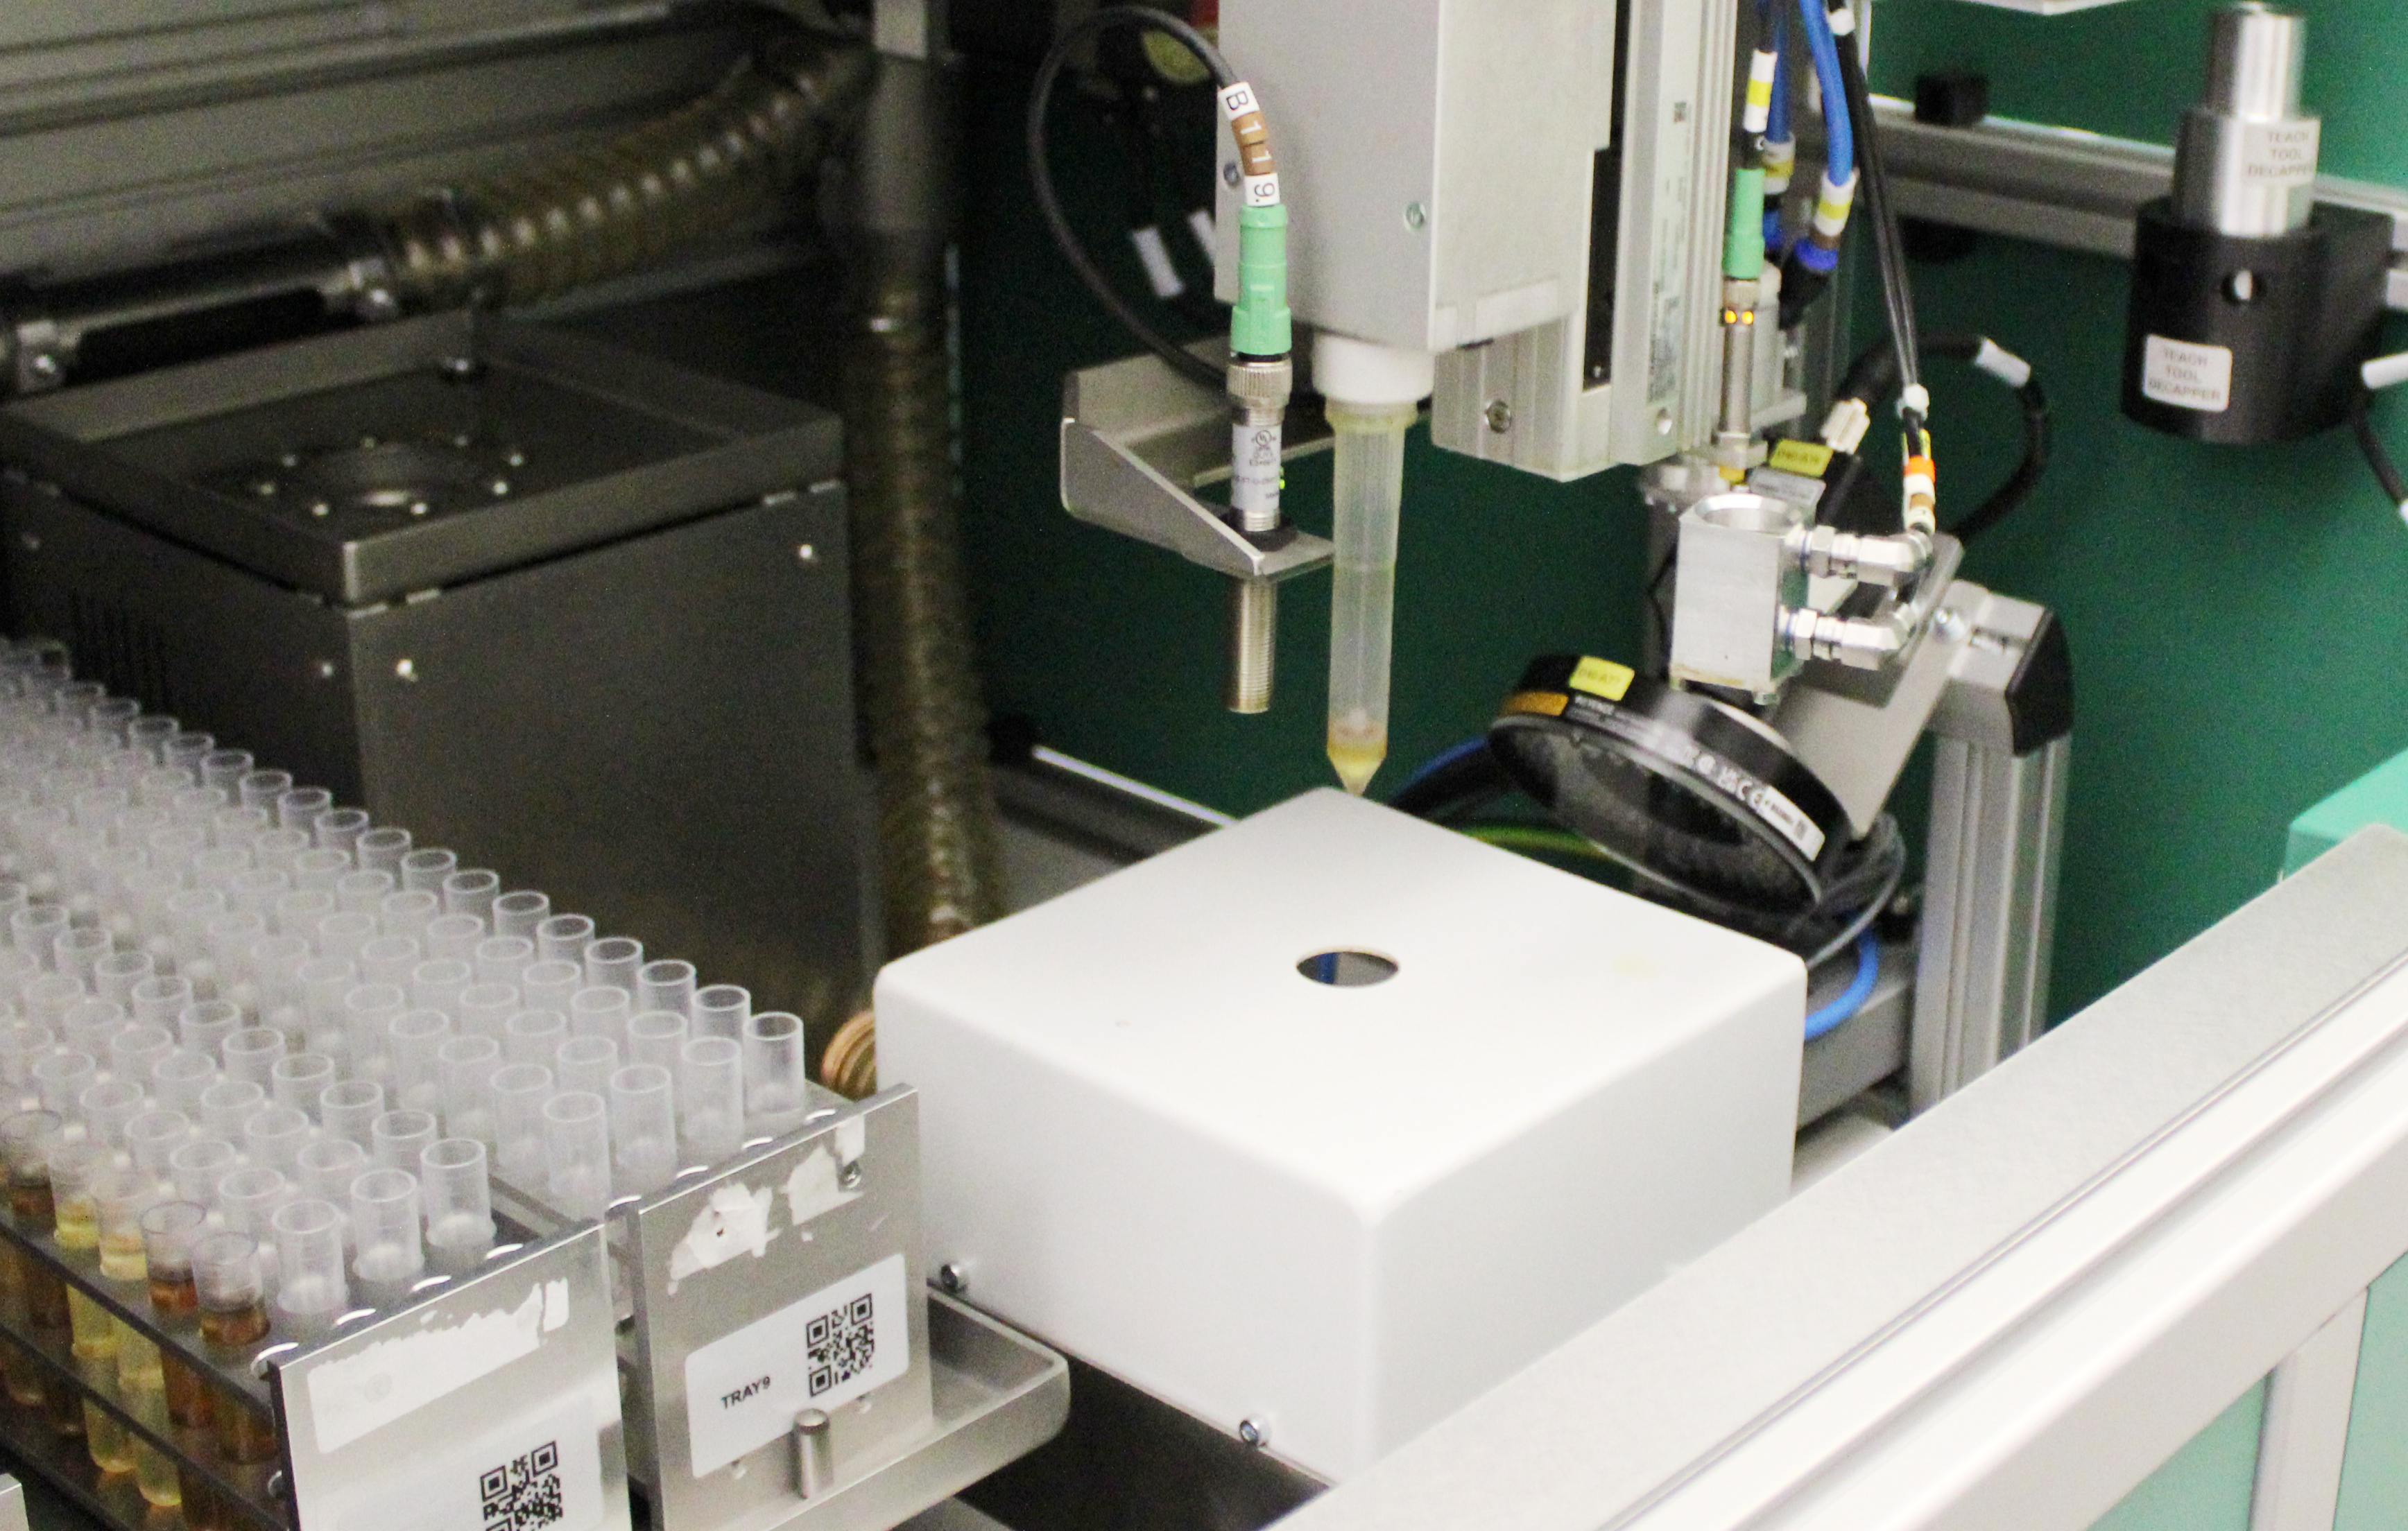
- Then a camera system first goes into action and takes a photo of each individual sample bottle standing on its head or lid.
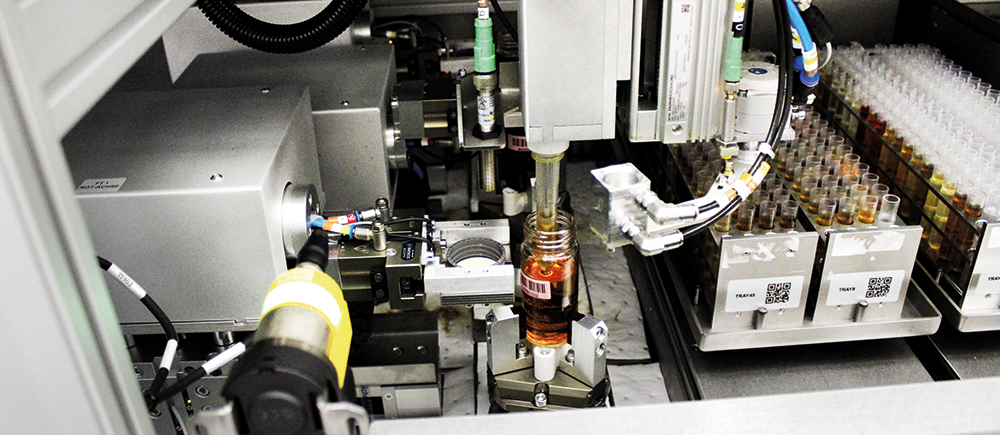
The colour of the sample, any turbidity and the fill level of the sample bottle are read automatically. - Grippers then turn the container upside down, open its lid and place it with the inside facing upwards.
This makes any deposits on it visible. - At the next station, photos are taken of the inside of the opened sample container and the sample lid.
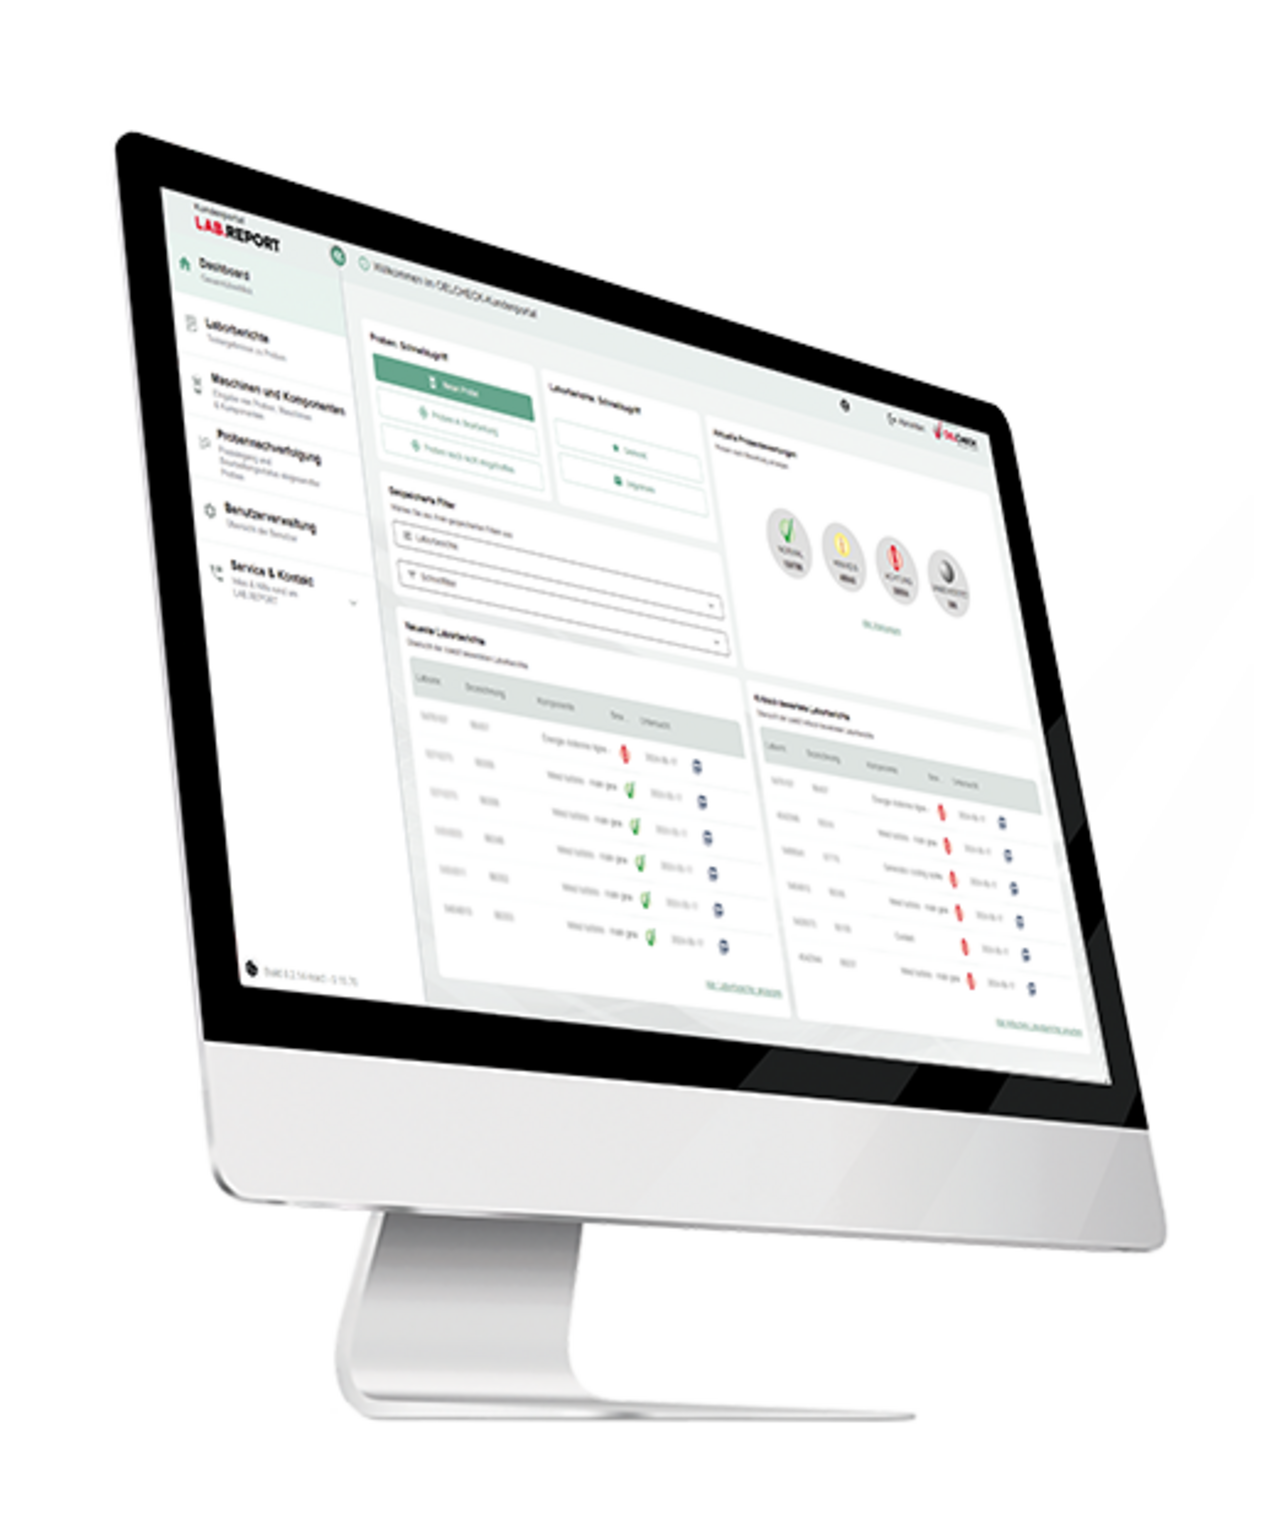
All images can be viewed by customers at https://lab.report and viewed in high resolution. - A computerised image analysis determines the degree of contamination from the photo of the sample lid with any deposits on it.
Color
In principle, the colour of an oil is not an absolute indicator of quality. After all, with very small quantities (less than 1 litre of pre-dissolved dye per 20,000 litres of oil) of the appropriate colouring agent, almost any desired colour can be produced. From pink to toxic green - almost anything is possible. Depending on the application, the consumer also expects a certain colour. Golden yellow for gear and hydraulic oils, red for ATFs, oils for medical equipment or food processing machinery should be as light as possible. Oils in air filters, on the other hand, are often blue.
In the case of non-coloured oils, the colour depends on the source, i.e. the well, the degree of refining and the intensity of bleaching of the base oil. However, the addition of additives, which in higher concentrations can appear as dark as black, can often make even water-light base oils significantly darker in colour.
However, the change in colour of an oil filling can also provide important information about ageing, e.g. oxidation or possible contamination in an oil. Quite simply, if the colour of a sample deviates from the previous sample in the trend, it may be due to an incorrect fill or overheating.
The colour impressions must always be comparable. The automatic image evaluation system identifies the colour intensity as 'colour' according to DIN ISO 2049.
Crackle Test
The automatic visual inspection also includes a so-called ‘crackle test’.
It is often used to detect water even if the oil does not look suspicious at first glance. In this test, a small drop of oil (only 0.2 ml) is sprayed onto a stainless steel plate heated to approx. 160 °C using a pipette. If the splashed oil contains more than approx. 0.1% water, the same happens as with hot oil in a kitchen pan into which a drop of water falls. The oil bubbles briefly and the water vapour escapes with a splashing, hissing sound. In conjunction with the small, precisely defined amount of oil, this produces typical bubbles or even larger ‘splashes’, which the image analysis can assign to water values according to their appearance and distribution in a 4-level table. This visual water determination is not the only type. Nevertheless, ‘crackling’ often provides additional information for our experienced tribologists alongside the determination of the water using FT-IR or the Karl Fischer method.
Finally, partial samples are prepared for the subsequent infrared spectroscopy and viscosity measurement. Only then is the sample container closed again and it leaves the automatic visual assessment.

