Dissolved Gas Analysis
Year of publication: 2011
Test standard:
ASTM D3612-02,
VDE0370-9:1994-06,
VDE0370-7:1999-12
Measuring range: 0-10,000
Unit: μl/l (ppm)
Sample volume: 50 ml
Determined: Dissolved gases in transformer oils
H2, O2, N2, CO2, CO, CH4, C2H6, C2H4, C2H2, C3H8, C3H6
![[Translate to "English"] TOGA GC 2](/fileadmin/_processed_/2/6/csm_TOGA-GC-2_freigestellt_667ba9f808.png "[Translate to \"English\"] TOGA GC 2")
The analysis of gases present in the transformer oil in dissolved form is carried out with a TOGA GC 2, specially developed for this purpose. This analytical procedure is used to evaluate defects in electrical equipment with the aim of initiating countermeasures in good time. Dissolved gas analysis is the most frequently performed method for monitoring transformers. It offers many advantages and not only for the detection of defects:
- Reliable information on the condition of a transformer
- Timely recognition of defects
- Condition monitoring of new and repaired systems
- Scope for planning of measures.
The basic principle of the dissolved gas analysis is based on the capacity of the insulating oil to dissolve not only air from the atmosphere, but also cracked gases. These evolve not only from the natural ageing of oil and insulation materials, but above all when thermal or electrical defects occur in transformers. The extent of a defect and its increase over time (trend analysis) can be concluded from the quantity of dissolved gases in the respective oil.
The cracked gases, also termed pollutant gases, evolve as a result of high-energy electrical discharges as well as partial discharges. However, local overheating can also cause the evolution of pollutant gases. If pollutant gases are discovered in the analysis of the transformer oil, this indicates sources of defects in the transformer.
These dissolved gases can only be measured with a gas chromatograph (GC). In order to ensure correct measurement results, the oil sample must not come into contact with atmospheric oxygen. For this reason, as soon as the oil is sampled, it is poured into a 20 ml gas-tight glass syringe. A crimped head space bottle is flushed with argon to remove air. From the syringe, 5 ml of sample are injected directly through a canula via the 3-way stopcock. In the sampler, the gases are expelled from the sample at 80°C and are then gradually heated in a GC oven up to 200°C. The escaping gases are flushed with the aid of argon (carrier gas) through a „column“ (about 10 m long, wrapped small glass tubes). Depending on the structure of the respective gases, these remain on the surface of the column for different lengths of time. In order to ensure clean separation, two different columns are used. Detectors recognise the individual components and record corresponding chromatograms. The larger the area under a peak, the greater the proportion of the corresponding component.
DGA chromatogram of a used transformer oil
The following pollutant gases are determined using the chromatograph: H2 (hydrogen), O2 (oxygen), N2 (nitrogen), CH4 (methane), CO (carbon monoxide), CO2 (carbon dioxide), C2H6 (ethane), C2H4 (ethene/ ethylene), C2H2 (ethyne/acetylene).
In the laboratory report, the respective individual values and their sum are indicated in μl/litre and/ or ppm. An analysis is recommended at regular intervals, since by observing a trend, it is possible to react to changes in good time.
Depending on the intensity of the individual gases, differentiation is made between different defects. Different conclusions can be drawn from the respective defects with regard to the consequences for the oil or paper insulation. These values and their diagnoses are noted in the laboratory report in compliance with evaluation procedures defined in the VDE standard.
Type of | Cause of defect | Effects, appearance |
PD | Partial discharges | Paraffin wax formation on the paper insulation |
D1 | Low energy discharges | undissolved small carbon particles in the oil, larger holes in the paper insulation |
D2 | High energy discharges | Carbonisation of the oil, destruction of the paper insulation, molten metal |
T1 | Thermal defects, temperatures of | Oil oxidation, brownish discolouration of paper |
T2 | Thermal defects, temperatures of 300 to 700°C | increased oil oxidation, carbonisation of paper |
T3 | Thermal defect, | Oil carbonised, |
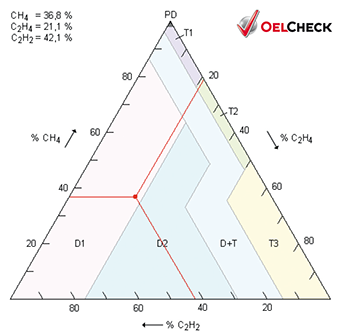
In addition to the values for pollutant gases, the Duval triangle is illustrated in the laboratory report. This allows the visualisation of the type of defect present. At increased concentrations, a summary statement can be generated using this tool.
Example: in a DGA analysis, the following percentages were calculated based on the ppm values: Ethylene (C2H4) = 36.8%, acetylene (C2H2) = 21.1%, methane (CH4) = 42.1%. These values are entered into an isosceles Duval triangle parallel to the sides. The point at which the three lines intersect lies in a field with the types of defect listed in the table. In this way, a conclusion about the type of defect present in the case of example = D1 can be made.
Guideline values according to DIN EN 60599, above which more frequent analyses are advisable:
Gas component | 90% concentration values in µ/l | |
Hydrogen | H2 | 60 - 150 |
Carbon monoxide | CO | 540 - 900 |
Carbon dioxide | CO2 | 5.100 - 13.000 |
Methane | CH4 | 40 - 110 |
Ethane | C2H6 | 50 - 90 |
Ethene | C2H4 | 60 - 280 |
Ethyne | C2H2 | 3 - 50 |