

Particle counting in field application: procedure, benefits – and reproducibility
Year of publication: 2026
During a routine examination of our hydraulic oil, an unexpectedly poor cleanliness class was determined. To verify the result, we sent the same sample to a second laboratory – and received a different cleanliness class there. How is it possible that two laboratories arrive at different results from the same oil sample?
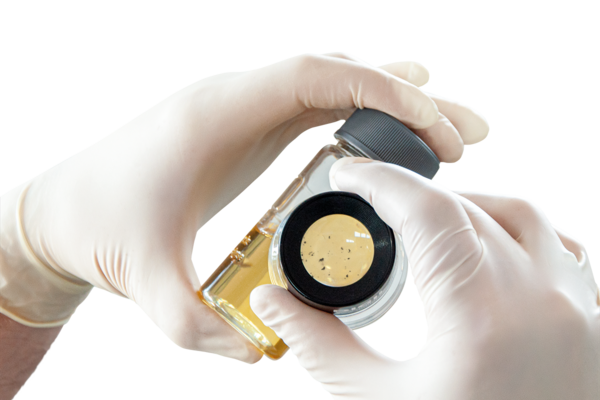
One value, two norms
Some users may have already observed the following: OELCHECK reports a cleanliness class for a sample and provides a recommendation for oil maintenance. It can occasionally occur that the user's own particle counter (or other laboratory findings) shows a deviating value for samples from the same system. Such observations can almost always be explained. Although cleanliness classes are reported according to a uniform standard, multiple permissible variants exist for the counting method.
The most widely applied classification worldwide is ISO 4406. It consolidates counted particles into three size ranges – greater than 4 µm(c), greater than 6 µm(c), and greater than 14 µm(c). The result is presented as a three-part code, for example 19/17/14.
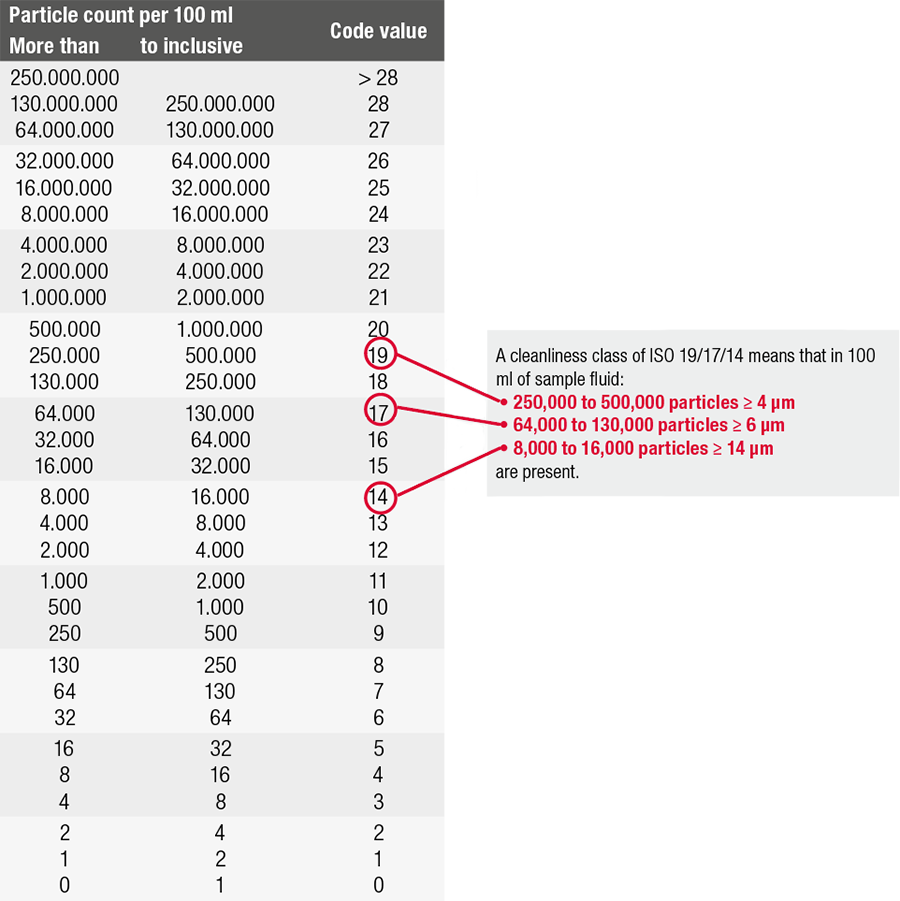
This conversion has proven effective: Measurement values are processed into classes using statistical methods, thereby becoming more comparable and easier to interpret. The division of responsibility between two standards is important here: ISO 4406 specifies how a result is presented; ISO 11500 in turn governs how measurement is conducted. This counting standard deliberately provides laboratories with discretion in sample preparation, which each laboratory utilizes according to its specific task.
Reasons for sample dilution
Ideally, a sample is measured undiluted. However, this requires a largely "clear view." In laboratory practice, however, turbid used lubricants predominate, which contain reaction products, moisture, or finest air bubbles. High viscosity or a dark sample also indicate dilution.
ISO 11500 permits several solvents for this purpose – ranging from mineral oil to gasoline fractions to iso-propanol and toluene – which differ in their polarity and thus in their effect.
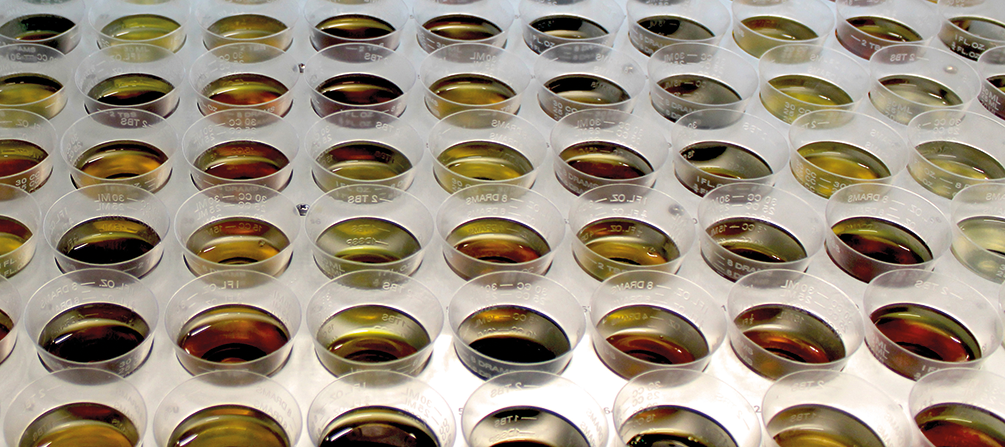
This is precisely where the expertise of the OELCHECK laboratory comes into play. For many years, a procedure has been employed that ASTM D7647 describes as "water-masking": a mixture of 25 percent iso-propanol and 75 percent toluene. It dissolves the finest water droplets as well as a substantial portion of aging products – those soft constituents referred to as "soft contaminants" or varnish.
The contribution of sensor technology
A second influencing factor is the measurement technology. Modern laboratories operate with laser light sensors. OELCHECK operates multiple instruments in parallel. Occasionally, older white light sensors are still in use in the industry, whose lower light intensity produces less distinct images of fine particles. In practice, this can amount to two to three cleanliness classes. A deviating value can thus simply originate from a different instrument generation. By contrast, calibration is clearly regulated: For automatic counters, ISO 11171 applies with NIST-traceable test dust ISO MTD.
A rule of thumb has become established for evaluating deviations: Two measurement results are in good agreement when they deviate from each other by no more than ±1 class per channel. OELCHECK performs three measurements per sample and compares them – an internal control that ensures high reproducibility. If we remain within ±1 class across laboratories, this represents an excellent result.
Two procedures, distinct advantages
From this systematic approach, it becomes clear why OELCHECK maintains two procedures for its customers.
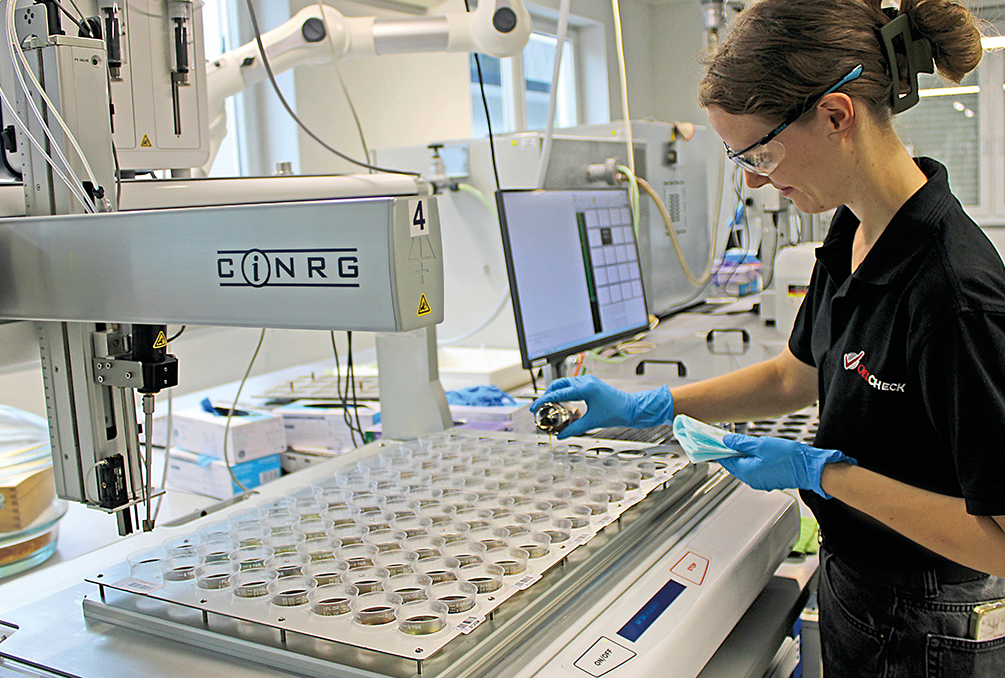
The standard method is laser particle counting: The diluted sample is passed through a flow cell. When particles block the laser beam, the sensor registers the shadowing, which is electronically evaluated and compared against the calibration dust. This method is highly automatable, extraordinarily stable and is the method of choice for hydraulic, turbine, and insulating oils. High-viscosity gear oils can likewise be measured with appropriate dilution.
For certain media, an alternative approach is recommended: In aqueous hydraulics with emulsion constituents, ultrafine droplets are generated; in cutting oils, very high particle loads are to be expected. Here, microscopic particle counting according to ISO 4407 demonstrates its strengths: The sample is filtered through a filter membrane with 1.2 µm pore size, the dried membrane is scanned under an automated microscope and evaluated by image analysis software. Exclusively solid particles are detected.
Additionally, there is a knowledge gain that no other method offers: Under the microscope, it becomes visible whether metallically lustrous particles indicate wear or whether dust particles and/or soft deposits are present. Even fibers can be classified – occasionally they do not originate from the system at all. On the filter images, one frequently observes fibers that presumably were introduced during sample collection. This is an indication of how much careful sampling contributes to the reliability of results. Microscopic counting is offered as a special examination with an additional laboratory report page; OELCHECK has recently acquired a state-of-the-art microscope for this purpose (further details on page 6 of this issue).
Gaining certainty for users
This results in a recommendation for OELCHECK customers that is easy to implement: Plant operators should monitor the development at their own facility over a certain period of time. With consistent analytical procedures, the trend derived from this provides the most reliable insights.
Who regularly submits samples reliably recognizes how fluid cleanliness develops – and obtains answers to two central questions:
1. Is the filtration operating as intended?
2. Are new particles continuously entering the system?
Equally informative is precisely determining the cause of elevated values: Are these hard particles – or merely aging products that have agglomerated to such an extent that they are detected as particles in the test? This differentiation leads to different measures: In the case of advanced oil aging, more intensive filtration is not the method of choice, because additives can also be removed in the process. The numerical code itself provides an initial indication. A classification such as 22/20/12, whose last figure drops significantly compared to the elevated preceding values, for example, suggests water, sludge or varnish rather than hard particles.
The parameters in interaction
This names the core issue: Particle counting is a meaningful parameter – and unfolds its full significance in combination with additional results. Only together with water content, elemental analysis, FT-IR spectrum, neutralization number and depending on the specific question, the MPC test, does a reliable picture emerge. Which cleanliness class is required depends on the application: Servo valve technology, for example, places higher demands than an industrial gearbox. It is becoming apparent that sample preparation will be further standardized in the future – work is underway at ASTM and FVA.
Until then, the following applies: An OELCHECK laboratory report contains more than mere numerical sequences. Our tribologists classify every result in the context of the respective machine – and are available at any time for follow-up questions.
OELCHECK answers your questions on the topics of lubricant and operating fluid analyses as well as tribology.
Contact us by email (info(at)oelcheck.de)!
OELCHECKER Summer 2026 | Page 10-11


