Viscosity
The single most important physical characteristic of any oil
Viscosity is the most important physical characteristic of an oil. It plays the decisive role in the choice of accompanying lubricant as it describes its fl uid characteristics. It is also dependent on temperature and can be infl uenced by special additives. Since it can change when an oil is being used, it is one of the most fascinating and extensive topics in lubricant analytics. OELCHECK principally assesses viscosity in oil samples at 40°C and 100°C and calculates the viscosity index from this. Several modern devices have been installed in the laboratory just for determining viscosity alone.
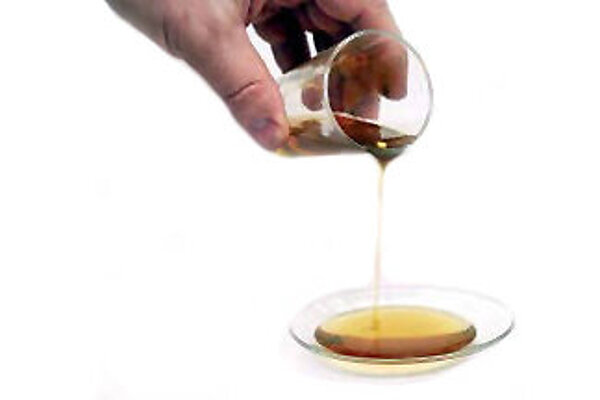
Viscosity nowadays means a measurement of the flowability of a lubricating oil or hydraulic fluid. The higher the viscosity, the thicker the oil. And the lower the viscosity, the thinner the oil. Thin lubricating oils are mostly deemed to have low viscosity and thick lubricating oils are deemed to have high viscosity.
But viscosity isn’t just measured for lubricating oils or paints and adhesives. Nearly all physical media and foodstuffs have a specific viscosity. The concept takes its name from the typically gooey sap that comes from mistletoe berries (viscum). Glue used to be extracted from the mistletoe for catching birds. “Viscous” therefore originally meant “sticky like birdlime”. The viscosity of this paste was, however, altered in Roman times, for example with honey. Whether thin or thick, the viscosity of a modern lubricant is accurately adjusted nowadays to suit its intended use.
Viscosity itself is not a characteristic of quality.
A viscosity reading simply tells you how thick or thin an oil is. At the same time, however, it is the most decisive key figure for describing an oil’s capability to build a separating lubricating film between two moving parts. When a machine is started, the oil must not be to viscous because otherwise it will not reach the areas that need to be lubricated in time. Conversely, if it is too thin at the operating temperature, it will not be able to guarantee a sufficient lubricating film to protect it from wear. If an oil is used as a hydraulic fluid, it must in turn demonstrate particular fluid behaviours in order to enable the desired power transmission.
If the wrong viscosity is chosen, the catastrophic consequences can be more drastic and occur faster than if the wrong type of oil is used. If, for example, an ISO VG 320 oil is used in a screw compressor which should be supplied with an ISO VG 32 oil, usually the damage will occur after just a few minutes. If the compressor is lubricated using the wrong type of oil, such as an HLP 32 hydraulic oil, then problems will only become apparent after a few thousand hours.
Viscosity: dynamic and kinematic
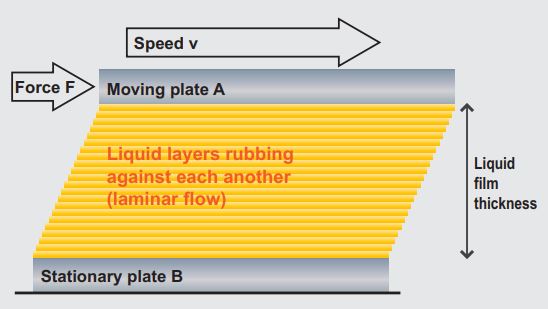
In physical terms, viscosity reflects the internal friction which ensues when neighbouring liquid layers are displaced. In highly viscous oils, these layers are bound together much more strongly and are therefore less moveable. In the case of dynamic or “true” viscosity, flow resistance within a liquid is measured. It is provided in data sheets or laboratory reports in mPas (millipascal-seconds) or cP (centipoise). For calculations, the uniform SI unit kg/m*s is used. The idea for the model is that the force exerted to displace a liquid, which is located between two plates arranged in parallel, is measured.
Top plate A, which rests on the liquid film, is moved with force F at a constant speed v parallel to the base plate. The liquid film, which is directly under the moving plate, sticks to it completely. Due to internal friction in the liquid, layers which are further away are displaced a bit further in the direction of movement. However, this displacement decreases in the direction of the “base plate” with each layer. In turn, the very bottom layer remains motionless as the film, stuck to the base plate. The model diagram shows the displaced positions of the layers at the end of the test.
The following formula, which is dependent on the number of liquid layers (h), applies for dynamic viscosity: Dynamic viscosity = shear stress (force F / moving plate A) / shear rate (speed v / liquid film thickness h).
Dynamic viscosity often used to be determined using falling ball viscometers. Nowadays, rotational viscometers are also used whereby an object is rotated in the oil of a liquid by a motor or a solenoid. This measures the required torque. From that and also from the exact geometry of the rotational object used and the external geometry, the viscosity can be calculated based on the rotational speed.
Kinematic viscosity
Since it takes a high level of metrological effort to calculate dynamic viscosity, the practical kinematic viscosity calculation method was established. This describes the “viscosity-density ratio” and is expressed using the SI unit mm²/s or often the “centistoke” (cSt). The principle of measuring kinematic viscosity is based on the time it takes an oil to flow through a defined route of a capillary at a certain temperature using gravity. With the help of the capillary constant of the “viscometer”, kinematic viscosity is calculated based on the flow time.
Kinematic viscosity is calculated by dividing dynamic viscosity by density. Dynamic viscosity is calculated by multiplying kinematic viscosity by density. With these calculations, it is important to note that, prior to this, the density, which is usually indicated at 15°C for lubricants, must be converted for a density at 40°C or 100°C or the operating temperature (xx) according to the formula dxx = d15 - (xx -15)*0.00067
Viscosity changes
Unlike water, which has almost the same flowability between 0°C and 100°C, the viscosity of oil varies hugely according to temperature. In addition, operating pressure or factors, such as oxidation or impurities, also influence viscosity. Unfortunately, it gets even more complicated, because the flowability of an oil does not change uniformly, i.e. linearly, with temperature.
Viscosity-temperature behaviour
When the temperature drops, an oil will always become thicker, i.e. will have a higher viscosity. When the solidifying point is eventually reached, the oil will become so thick that it can no longer move at all. On the other hand, when the temperature increases, the viscosity drops considerably. The oil can become extremely thin. These temperature-dependent changes must be taken into account when choosing a lubricant. Particular care needs to be taken since viscosity-temperature behaviour depends on the type of oil. Even oils with the same viscosity at, for example, 40°C can behave totally differently at 0°C or 100°C.
A temperature-dependent viscosity change will not be linear but can be calculated “double logarithmically”. Temperature differences of, for example, 10°C do not lead to identical number jumps in viscosity changes. The viscosity index (VI), which is calculated with the aid of kinematic viscosity measured at 40°C and 100°C, is used to describe an oil’s viscosity-temperature behaviour. This parameter allows the viscosity behaviour of various oils to be better compared based on temperature. The calculation method described in ISO 2909 was developed approximately 60 years ago. In terms of the viscosity index, the worst mineral oils known at the time were awarded a VI of 0, and the mineral oils with the best viscosity-temperature behaviour were awarded a VI of 100. At the time, there were no synthetic or multigrade oils. Nowadays, viscosity can be influenced by so-called VI improvers or synthetic oils to such an extent that the viscosity index now extends far beyond 100. The following standard values illustrate how high the viscosity index can be taken by modern oils:
Oil or fluid type | Viscosity Index |
Mineral oil | ~ 95 - 105 |
Multigrade oil | ~ 140 - 200 |
PAO oil | ~ 135 - 160 |
Ester | ~ 140 - 190 |
Vegetable oil | ~ 195 - 210 |
Glycol | ~ 200 - 220 |
Silicone oil | ~ 205 - 400 |
A simple and widely-used method for visualising viscosity-temperature behaviour is the viscosity-temperature diagram (VT diagram) according to Ubbelohde/Walther. Using the mathematical conversion (double logarithmical calculation), VT behaviour can be approximated to such a degree using a straight line through two points (usually at 40°C und 100°C), that viscosity at all other temperatures can be read from the diagram.
Different fields of application can be illustrated using the VT diagram. HLVP oil with a higher viscosity index can, for example, cover a broader temperature range.
Viscosity-pressure behaviour
Oils also become thicker with increased pressure. Viscosity-pressure behaviour is also a lubricantspecific parameter which can however, for the most part, be neglected since, at pressures below 400 bar, it is virtually insignificant. The change in viscosity due to an increase in pressure of 100 bar is disproportionately less than that due to an increase in temperature of 10°C. Designers of highperformance hydraulic systems and components always consider the infl uence that pressure has on viscosity whilst also allowing for the temperature influence which occurs simultaneously.
Amongst other things, lubricants are tasked with protecting the surfaces of pairs of moving parts against wear by building a resilient lubricating film. There is the positive effect that, with traditional lubricating oils, the viscosity in the lubricating film is increased to such an extent on account of the prevailing pressure on it that the surfaces are kept apart.
In metrological terms, the viscosity of a lubricating oil, which has been changed on account of high pressure, is very difficult to determine. Only a handful of institutes, such as the RWTH in Aachen, can also actually carry out such measurements.
Viscosity changes in oil applications
With regards to oil changes, the most important parameter in used oil analyses is the consideration of viscosity changes. The viscosity of an oil can change for reasons other than just temperature and pressure. If the viscosity of a sample differs from the initial values of the fresh oil or the reference of the previous analysis, the causes may be as follows:
Increase in viscosity
- During operations, the oil has absorbed oxygen on account of the temperature and has therefore been oxidised.
- Oxidation inhibitors, ageing-delaying additives have decomposed.
- Ageing and oxidation products, such as acids and oil-insoluble components have formed.
- Varnish-like deposits, such as resin and sludge, have built up.
- Soot, dust, water or residues from alternative fuels are contaminating the oil.
- The wrong oil was used or refilled.
Decrease in viscosity
- VI improvers, additives for improving the viscosity index, were not shear-stable and have decomposed.
- Unburned fuel (poor combustion) has diluted the oil.
- An oil which was too thin or the wrong type of oil was used or refilled.
- The system was cleaned with a thin flushing oil prior to being filled. Flushing oil residues have got mixed in.


Viscosity classes or groups
Almost every oil denomination has a number, the so-called viscosity class for automotive oils or viscosity group for industrial oils. The groupings are a big help when it comes to choosing the viscosity for the “right-fit” oil. Just like a shoe size, a viscosity class simply represents a “value that fits”. Just like when you’re buying shoes and you have to make it clear what you need them for, for example walking, dancing, running, etc., when you’re considering lubricants you have to know what machine they will be used in and what operating conditions they will be exposed to.
The SAE classes for engine oils, defined by the American Society of Automotive Engineers, were introduced back in 1911 practically all around the globe. Prior to 1950, in Germany, industrial lubricants were distinguished from each other on the basis of their flowability at 50°C according to Engler degrees. By defining the ISO VG viscosity groups, in 1975 the International Standards Organization (ISO), together with other leading institutions, came up with a helpful tool for selecting industrial lubricants based on kinetic viscosity at 40°C (instead of 50°C in Europe or 100°F in USA). A comparison of viscosities according to ISO VG (at 40°C) and SAE (at 100°C or for winter oils in the bottom temperature range) is limited since the thresholds of viscosity classes are not congruent. It is particularly diffi cult in the case of multigrade oils.
ISO viscosity groups for industrial oils
The system covers 18 viscosity ranges. In accordance with DIN 51 519, the minimum and maximum kinematic viscosity for each class is defined in mm²/s at 40°C. The thresholds for each class account for a ± 10% deviation from the midpoint viscosity. No VI or second viscosity is provided. Therefore, the ISO VG cannot make any claims about viscosity-temperature behaviour. With the exception of multigrade hydraulic oils, specifi ed in DIN 51524-3, the multigrade characteristic is of secondary importance in the field of industry not least because industrial machines are operated at a constant temperature.
Oil or fluid type | Viscosity Index |
Mineral oil | ~ 95 - 105 |
Multigrade oil | ~ 140 - 200 |
PAO oil | ~ 135 - 160 |
Ester | ~ 140 - 190 |
Vegetable oil | ~ 195 - 210 |
Glycol | ~ 200 - 220 |
Silicone oil | ~ 205 - 400 |
Automotive gear oils were grouped by the organisation SAE according to the same system as automotive engine oils. It can, however, be misleading if the same column of figures has an extremely viscous SAE 60 engine oil and then extremely thin SAE 75W or 80W gear oils, in accordance with SAE J-306/DIN 51512. The classification for gear oils with their particularly high numerical values cannot therefore be seen as a simple continuation of the engine oil classification. An SAE 80 gear oil is also not twice as “thick” as an SAE 40 engine oil.
However, gear oils that are suitable for use at low temperatures are also denoted with a W. The table for gear oils wasn’t updated until the end of 2005 with classes SAE 110 and SAE 190. It became necessary to do so on account of the broad viscosity range of the “old” SAE 90 (18.5 cSt up to <24 cSt at 100° C) and the old SAE 140 (24 cSt up to < 41 cSt at 100° C). The range meant that the actual viscosity of the different oils could deviate heavily although the oils were grouped in the same SAE class. The new, more tightly defi ned, viscosity classes SAE 110 and 190 increase the accuracy of viscosity specifications for gear manufacturers.
Industrial oils | |||
|---|---|---|---|
ISO VG | Midpoint viscosity | Kin. viscosity min. | Kin. viscosity max. |
2 | 2,2 | 1,98 | 2,42 |
3 | 3,2 | 2,88 | 6,52 |
5 | 4,6 | 4,14 | 5,06 |
7 | 6,8 | 6,12 | 7,48 |
10 | 10 | 9,00 | 11,0 |
15 | 15 | 13,5 | 16,5 |
22 | 22 | 19,8 | 24,2 |
32 | 32 | 28,8 | 35,2 |
46 | 46 | 41,4 | 50,6 |
68 | 68 | 61,2 | 74,8 |
100 | 100 | 90,0 | 110 |
150 | 150 | 135 | 165 |
220 | 220 | 198 | 242 |
320 | 320 | 288 | 352 |
460 | 460 | 414 | 506 |
680 | 680 | 612 | 748 |
1000 | 1000 | 900 | 1100 |
1500 | 1500 | 1350 | 1650 |
Viscosity and the VI in the OELCHECK laboratory
The determining of kinematic viscosity at 40°C and 100°C as well as the resulting standardised VI calculation are fixed components of the scope of analysis for each and every OELCHECK analysis set. In contrast to many other service laboratories, as a matter of course, we take measurements at both of these two temperatures. This is because the change in viscosity value can only be assessed in context through a change in the viscosity index.
Our laboratory operates six baths (3 x 40°C and 3 x 100°C), each with 4 capillaries, in order to regularly measure kinematic viscosity. These ISL Houillon viscometers have been retrofi tted with synchronous robots. They take exact doses of less than 1 ml of oil per capillary and do this for over 1,000 samples a day.
We normally determine dynamic viscosity only in exceptional cases. If an oil is so heavily contaminated that we suspect that the capillaries with diameters of approx. 0.1 mm are clogged, we use a Nametre Viscoliner 1710 to investigate dynamic viscosity at room temperature and at approx. 70°C and with the help of the temperature-corrected density we calculate kinematic viscosity at 40°C and 100°C. That way, it is possible to observe a trend even in heavily contaminated liquids. However, a designer sometimes needs more than just the viscosity-temperature curve for an oil, as displayed in a graph. In order to design bearings, lubrication holes, pump pressures or tooth widths, for example, they often need the actual dynamic viscosity at precisely defined upper and lower threshold temperatures. With the Anton Paar Rheometer Physica MCR 301 we therefore create a precise viscosity-temperature profile for the lubricant and measure its viscosity at intervals of 10°C within the temperature range of -30°C to +110°C.
Please note:
- Even if viscosity is not a direct characteristic of quality, it represents one of the most important key figures of an oil.
- For every oil sample, OELCHECK assesses viscosity at 40°C and 100°C and calculates the viscosity index from that. That’s the only way that conclusions can be drawn on the causes of viscosity changes with sufficient accuracy.
- OELCHECK laboratory investigations can ascertain whether:
- an oil with the prescribed viscosity was actually used.
- it is a synthetic, mineral, single-grade or multigrade oil.
- a viscosity change has taken place, which was caused, for example, by: oils being blended, contamination, decomposition of viscosity index improvers, dilution due to unburned fuel, oil ageing and a viscosity increase often associated with that.
- If the viscosity deviates too heavily from the value of the fresh oil or the previous sample, we urgently recommend carrying out an oil change. Depending on the oil type, what the oil is used for and its operating time, our warning values for viscosity changes are between 5% and 15%, but are even lower in the case of some sensitive applications (turbine lubrication and oil circulation systems).


ÖlChecker Summer 2012, page 5


